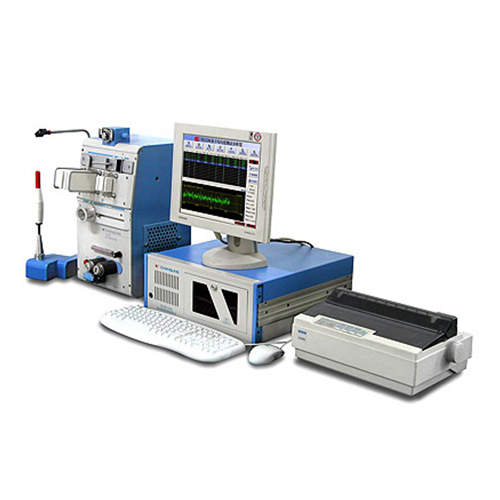
Evenness Tester is a universal high performance textile laboratory instrument which adopts latest electronic technology and computer technology to develop. This instrument is used to test and analyze linear density unevenness and unevenness structure character of thin yarn, roving and silver. It applies to cotton, wool, silk, flax, man-made fiber short fiber spinning and blending yarn, it is very important to improve and guarantee yarn quality.
MAIN FEATURES
Host processor adopts industrial control computer, entirely in Chinese graphic interface and convenient operation.
It can test and output CV% value, U% value and twelve level faults in real time.
It has variation-length curve, deviation ratio (DR) curve, spectrogram, linear density-frequency distribution, etc various graphic indices.
It has precise continuous spectrum which is more beneficial for user to analyze textile technical fault part.
Transmission system adopts import servo system, low noise and high reliability
Expert system can help user analyze textile technical fault bulletin and compare with USTER to evaluate spinning level.
It can store uneven curve and supply more detailed analysis for user.
SPECIFICATION
Capacitive measuring slot 5
Testing range 4tex-80ktex
Testing speed 4m/min, 8m/min, 25m/min, 50m/min, 100/min, 200m/min, 400m/min
Testing time freely set from 10s to 20min by 10s
Coefficient of variation CV% or U% value testing range 0.20%~99.99%
Variation-length curve cutting length 1cm~1472cm
DR% value and DR curve DR value testing range 0.01~99.99%
Reference length and threshold 20cm,+35%; 20cm,-30%; 1m,+5%; 1m,-5%
DR curve give reference length is 1cm, 10cm, 20cm, 50cm, 1m; threshold is from 0 to 50% positive and negative DR curve
Defect value thin places -30%, -40%, -50%, -60%
thick places +35%, +50%, +70%, +100%
neps +140%, +200%, +280%, +400%
Spectrogram testing wavelength range of common spectrogram 1cm~2937m number of spectrum channel 85
testing wavelength range of precise spectrogram 1cm~2937m number of spectrum channel 340
Linear density frequency distribution give two linear density frequency distributions one is in the range of -100%~+100% and one is beyond +100%
Number of batch test ≤24
Power supply voltage AC220V±10% frequency 50Hz/60Hz
COMPOSITION
monitor host processor (include display, keyboard, mouse) printer yarn creel
<i id='642eb'><strike id='5be4b'><tt id='0d647'><pre id='091e3'></pre></tt></strike></i>